Today MoSKito 2.7.3 is released, and it contains the hottest feature since long time. But decide for yourself.
The feature request goes back some years to Dec 02, 2010 to my time at Parship, as Malte once asked, if it would be possible to know where a call to a method actually came from. It was on the list since then, but time was hard to find.
So what are tracers anyway? Tracers have 3 purposes or aspects:
- Tracers allow you to find out which part of your code has been calling some methods in a class of your application you are interested in. They achieve it by guarding the class in question (works with most monitoring points) and triggering and saving a stack trace once something passes by. This is useful if you see strange behavior of some method/class in the MoSKito monitoring, but don’t know who is actually using this class.
- After the execution has passed the tracer, the tracer start to record everything that happens afterwards. This means that a TracedCall (part of MoSKito Journey) is created on the fly and recorded. Every call on the monitored class will be noted, along with parameters and return values.
- To round this up, tracer will gather some amount of traces (code passing by). Depending on how you configured MoSKito, the tracers could collect only calls with largest duration or simply oldest or newest calls. This way you can run a tracer over a long period of time, collect all slow calls and investigate what slows them down.
But let’s walk through the details with the Burgershop example webapp we already used so often.
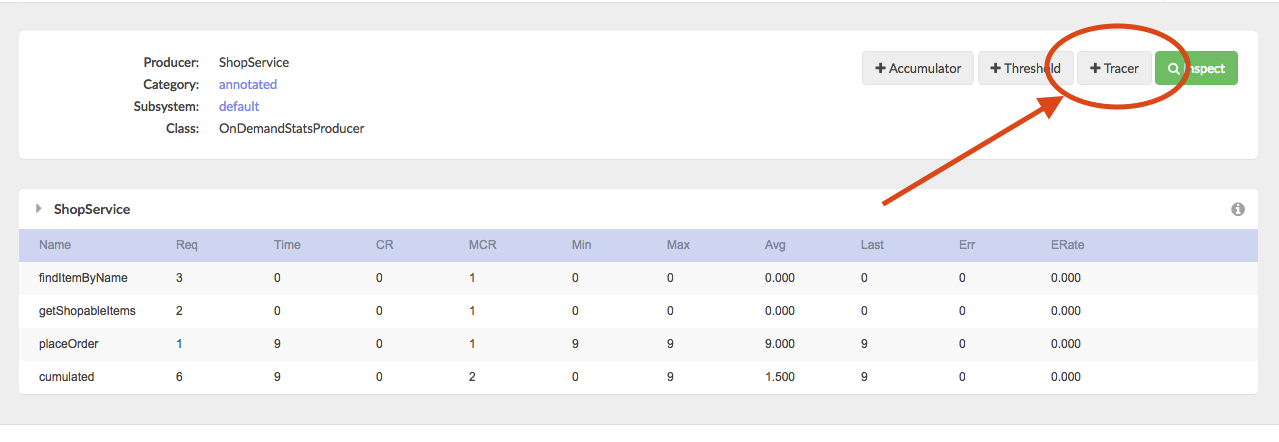
Whenever we open a producer view, there is a new Button “+Tracer” if the producer supports tracing. For now all AOP and Proxy style producers support tracers. In case you are wondering, AOP producers are matter of choice for Spring Applications.
 Once you hit the +Tracer Button as in the above screen, the Tracer becomes active. The view will change to acknowledge it:
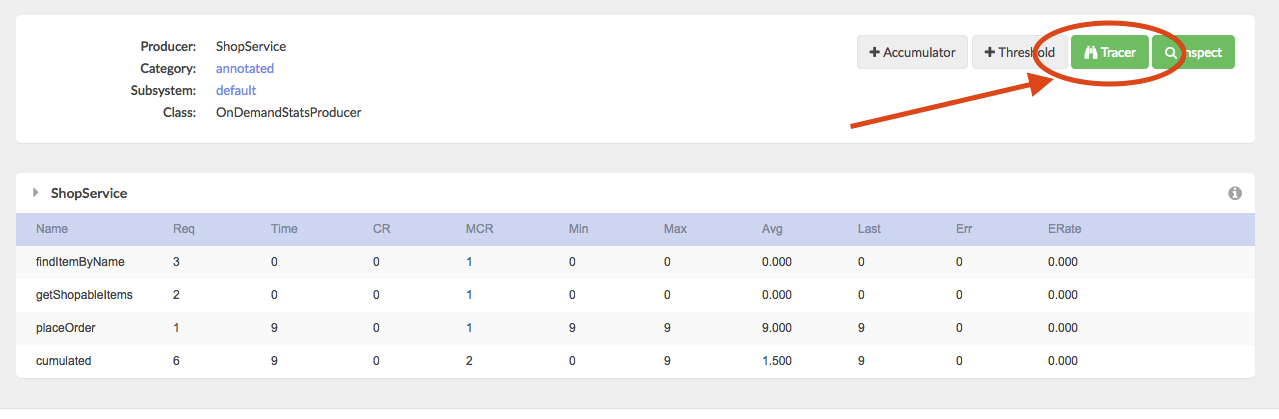
The green color indicates that the Tracer is active now. If you click on the green Tracer button you will jump in to the tracer view. Alternatively you can jump in the Tracers Section by selecting it from the Menu, as in the picture below.
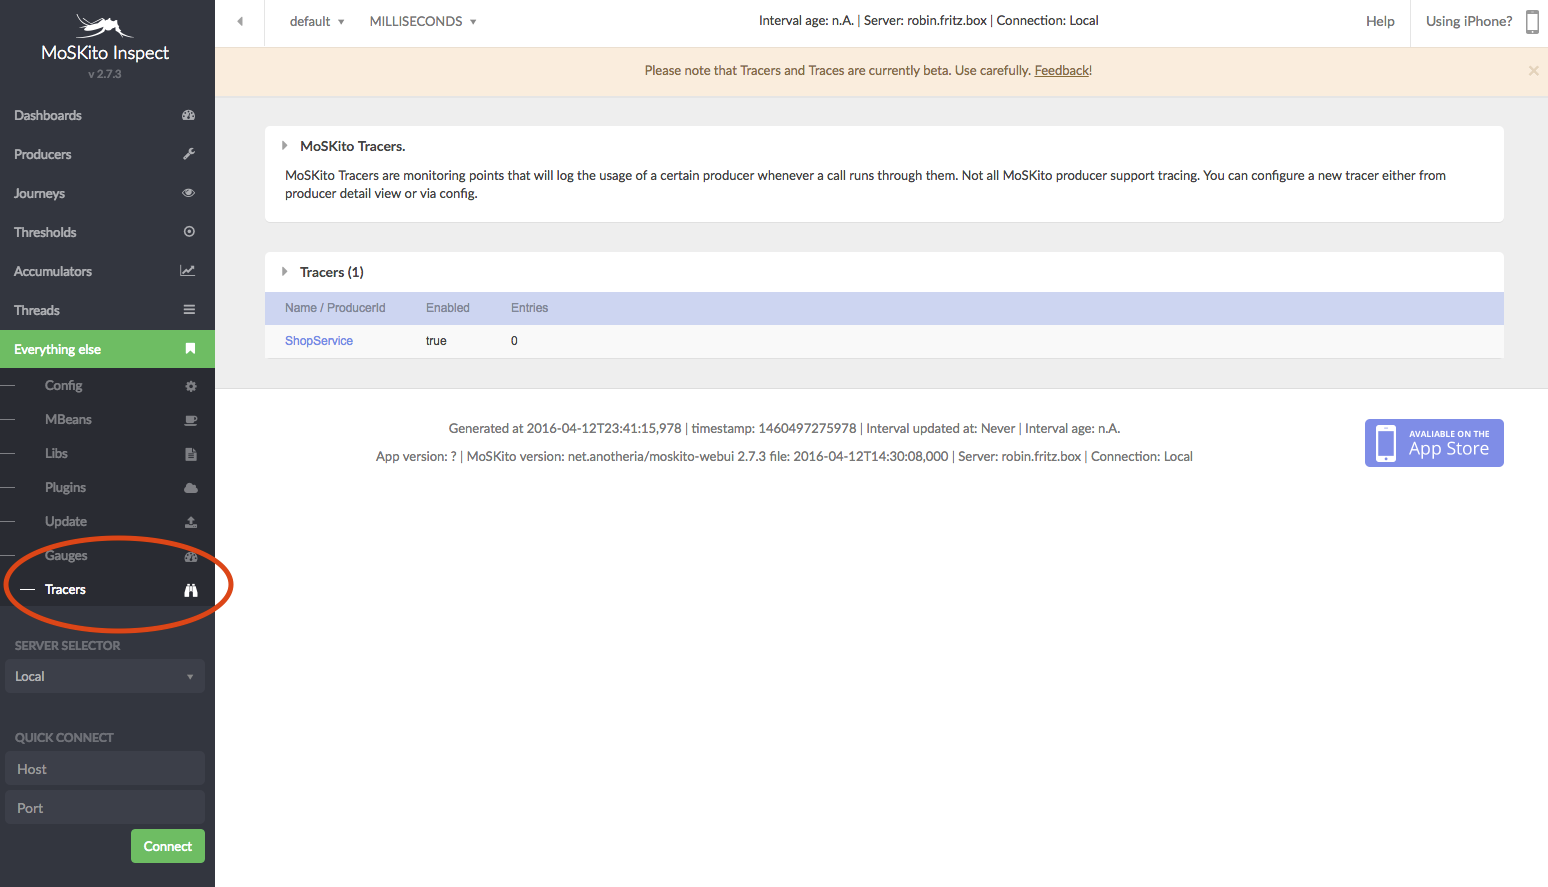
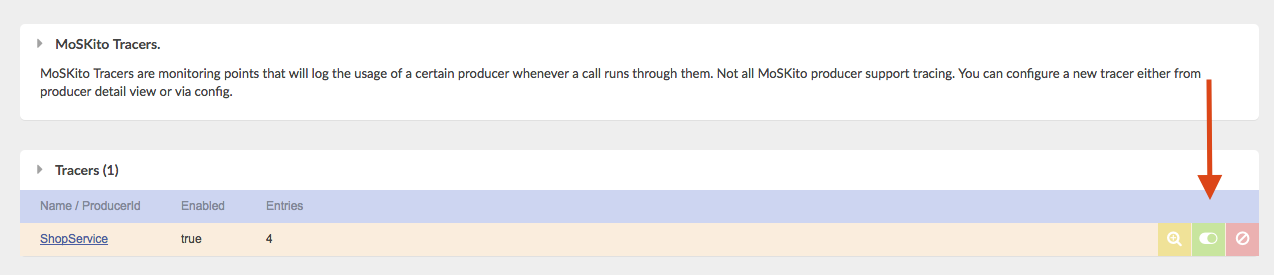
In the Tracers section you will have a line for each Tracer, along with the number of traces collected. As we didn’t do any requests to the application yet, there are no collected traces yet. Lets get some burgers to change that:
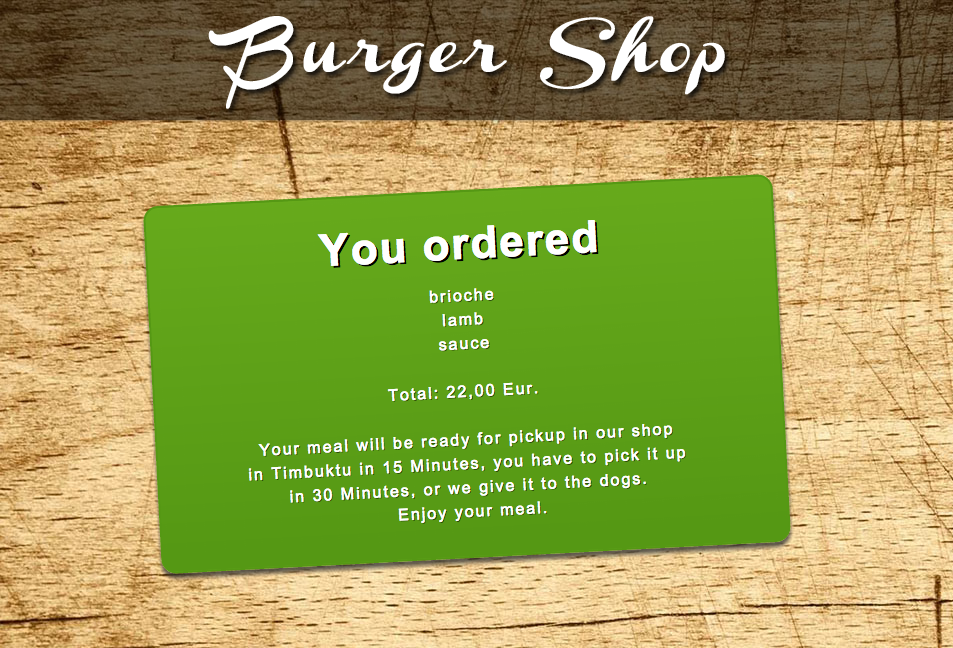
This order will make some traffic on the ShopService class we are monitoring (Remember the producer view in the first picture?) and MoSKito will trace them.
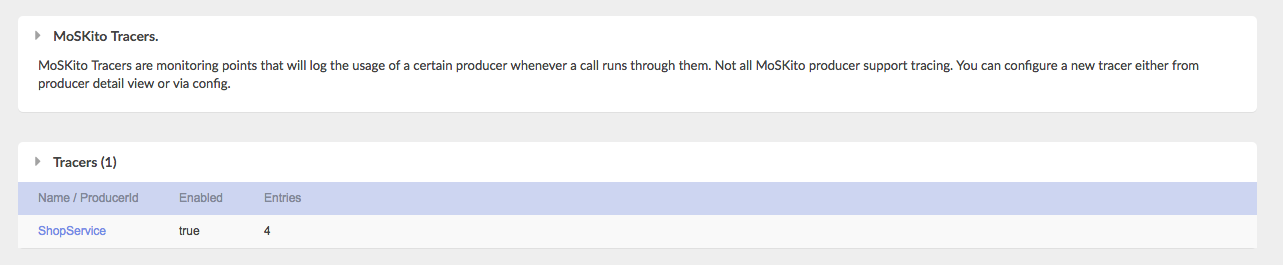
We now see that there are 4 entries in the ShopService entry. One for each call. The ShopService however calls itself recursively, therefore one burger order produces 4 calls to the service, and they are all traced.
Lets look into the Tracer by clicking on the ShopService.
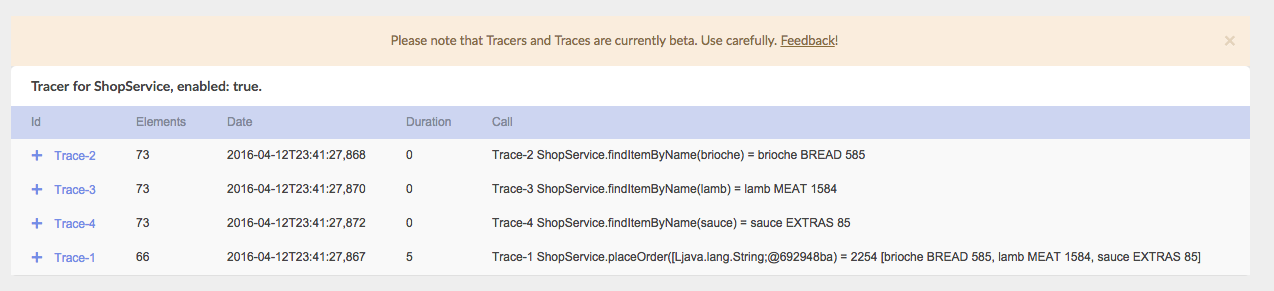
In the above picture I can see the 4 different calls to the ShopService, along with method called, time and date of the call, parameters and return value, as well as duration. If I hit the + button the stacktrace of the call will open and show me where the call came from:
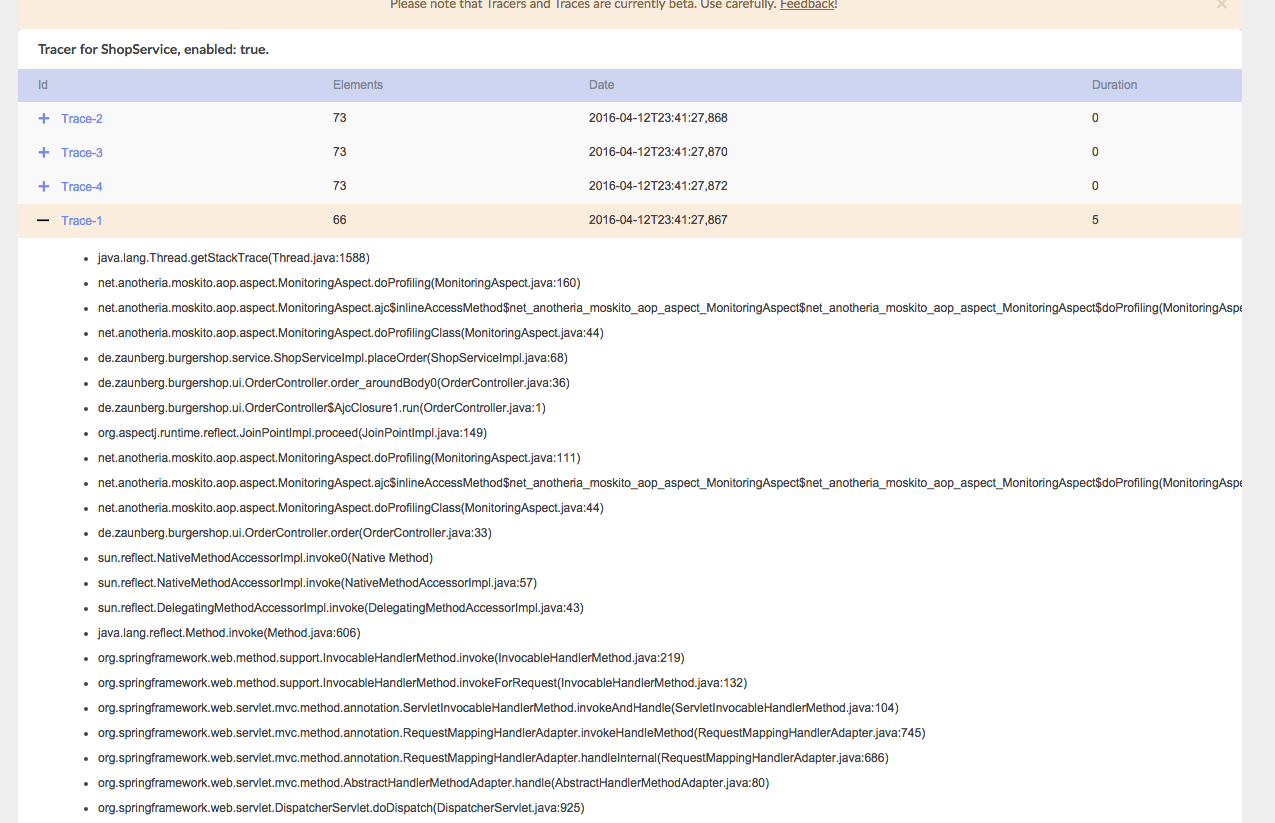
What happens after the call.
With this information I can find out who was calling my class and with what parameter. But what happens after the call? Happily it has been recorded and just one click away. You just need to click on the name to find out:
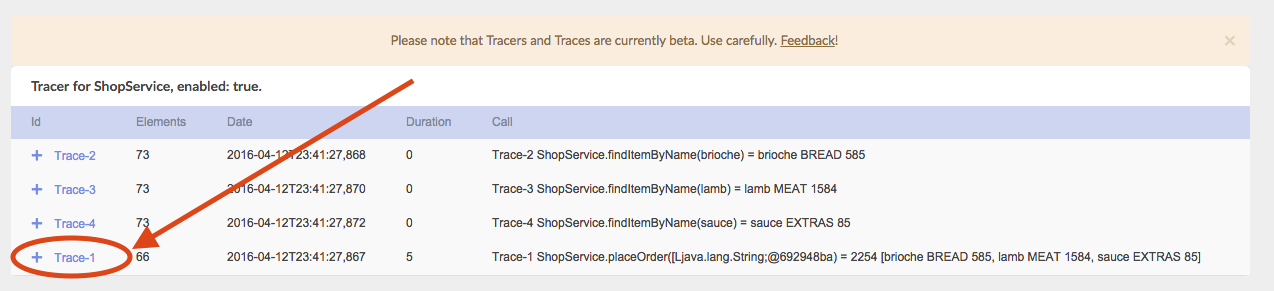
By clicking on the highlighted link I will directly jumping into a the recored call:
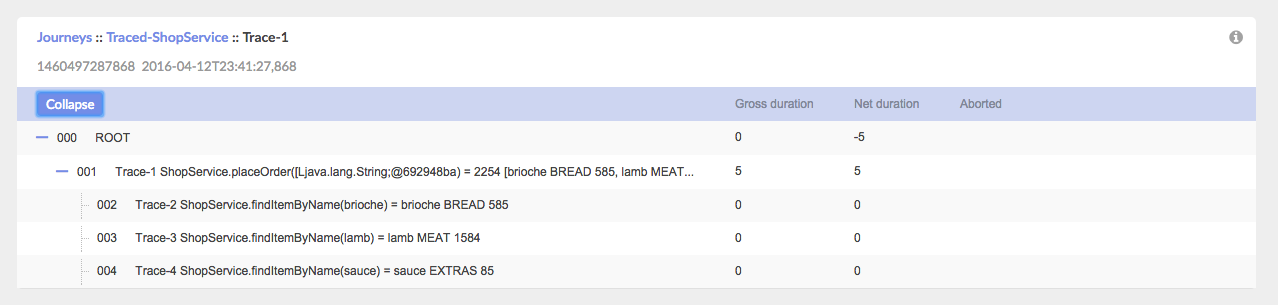
In this view I will see all called monitored classes as well as the parameter and time they took, both net (in the method itself) and gross (including following calls).
Tracers = Collections of Traces
What we discussed so far would be cool enough, but Tracers can do more, by utilizing MoSKito’s features for Journeys. Usually a Journey is bound to a user and all actions the user is performing in the system (see step-by-step integration guide). Tracers also use Journeys, but instead of being user-bound they are tracer-bound, meaning all calls through a tracer are collected in a journey. Besides pure organizational advantages it also allows you to use the analyze journey feature on traces. Analyze journey will calculate time spent in every component in every trace and cumulate this value on the whole journey (all contained calls).
So lets say you enabled tracer on a component and you selected the “KEEPLONGEST” strategy for trace retention (traces have to be collected from time to time to save memory). After some time the tracer has collected 50 traces with longest duration. Now you can just go to journey overview and click on the analyze button.
If you perform some more orders and collect more tracers, your journey might look like this (click on Journey in the menu):
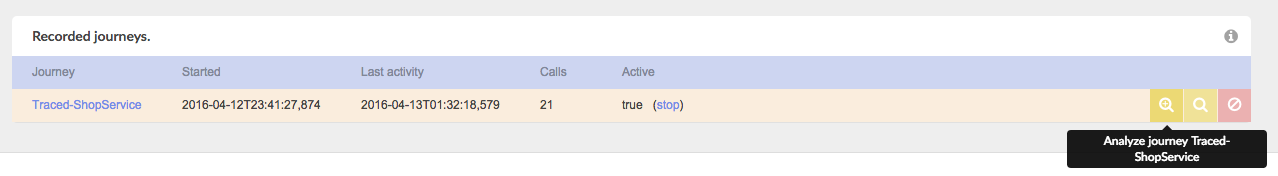
Noticed the small search-glass with a plus in it on the right? Clicking it brings us to the analyze screen:
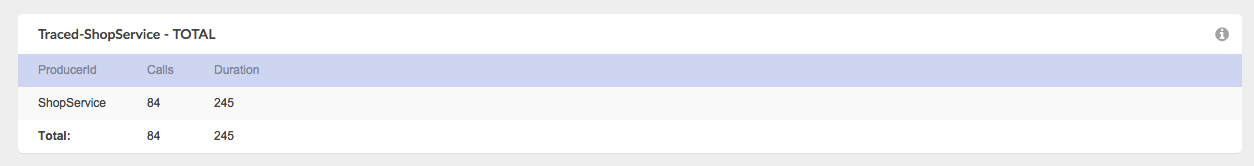
Now burgershop is pretty small application and there wasn’t much happening after the trace. This why I only see that we made 84 calls to the ShopService which took 245 ms. However, in a slightly more complex application you would see the time spent in every monitored component as well as the number of requests to that component over, lets say 50 (configurable) slowest calls in last 5 hours. Doesn’t it just sound awesome?
Stoping a Tracer
There are some more actions from the tracers overview I wanted to mention. Once a tracer is active you can disable and reenable it, as well as delete it. Deleting a tracer also deletes all collected calls and frees all resources. It won’t delete the journey however, this is something you have to click yourself for now. We may change it in the future if people find it more convenient.
Summing it up.
I hope I could enlighten your heart for tracers a little. So what can tracers do for you:
- Show where requests to a component come from.
- Analyze what consumes time in specific use-cases.
- Track slow executions of code and find out the reasons for it.
- … brew coffee (this one is still in alpha).
And they can do it all in the production environment with almost negligible impact to performance.
This is all about tracers for today. Enjoy monitoring your app!