Hello,
today I am going to speak about a concrete example of the MoSKito Control capabilities. Today we will build up a monitoring system, but not for WebApps as in previous posts, but for just plain java processes, that we are going to call daemons. Daemon, in my understanding, is just a plain old java bean/thread running in background in a separate JVM and doing some work. To make the post easier to write I created a small project on github that serves me as example:
https://github.com/dvayanu/moskito-control-rmi-cluster-example
The Setup
The project consists of two classes that will mimic or busy cluster.
First one is the Worker class, that should do some work, but, as it’s so often in real life, doesn’t do anything useful at all:
public class Worker {
 	public void doSomeWork(){
		//lets assume they do some work.
	}
}
The second class is the Daemon itself, which starts a new Thread, sleeps a while, forces the worker to do some work, sleeps again.
public class Daemon {
	public static void main(String args[]) throws InterruptedException{
		DaemonThread daemon = new DaemonThread();
		daemon.start();
		//wait forever.
		daemon.join();
	}

	static class DaemonThread extends Thread{
		public void run(){
			System.out.println("Daemon started. Will print something out every 60 seconds or so.");
			Random rnd = new Random(System.nanoTime());
			int sleepCounter = 0;
			long tasks = 0L;
			Worker worker = new Worker();
			while(true){
				try{
					Thread.sleep(20000);
				}catch(InterruptedException ignored){}

				int tasksThisTurn = rnd.nextInt(10);
				for (int i=0; i<tasksThisTurn; i++){
					worker.doSomeWork();
					tasks++;
				}

				sleepCounter++;
				if (sleepCounter==3){
					sleepCounter = 0;
					System.out.println("I am still alive, and I performed "+tasks+" tasks.");
				}
			}
		}
	}
}
This is all we need codewise, however, some maven magic is still to be performed, to be able to build and run the project:
<project xmlns="http://maven.apache.org/POM/4.0.0" xmlns:xsi="http://www.w3.org/2001/XMLSchema-instance"
  xsi:schemaLocation="http://maven.apache.org/POM/4.0.0 http://maven.apache.org/maven-v4_0_0.xsd">
  <modelVersion>4.0.0</modelVersion>
  <groupId>dvayanu</groupId>
  <artifactId>moskito-control-rmi-cluster-example</artifactId>
  <packaging>jar</packaging>
  <version>1.0-SNAPSHOT</version>
  <name>Monitoring a Cluster of Daemons with MoSKito Control over RMI.</name>
  <url>http://maven.apache.org</url>

  <build>
      <plugins>
              <artifactId>maven-assembly-plugin</artifactId>
              <version>2.2</version>
              <configuration>
                  <descriptorRefs>
                      <descriptorRef>jar-with-dependencies</descriptorRef>
                  </descriptorRefs>
              </configuration>
              <executions>
                  <execution>
                      <id>make-assembly</id>
                      <!-- this is used for inheritance merges -->
                      <phase>package</phase>
                      <!-- append to the packaging phase. -->
                      <goals>
                          <goal>single</goal>
                          <!-- goals == mojos -->
                      </goals>
                  </execution>
              </executions>
          </plugin>

      </plugins>
  </build>
</project>
I added a jar-with-dependencies assembly to my pom, because I feel that this is a very convenient way to start a console java script. Feel free to do something else.
Finally I added a startDaemon.sh script:
java -cp target/moskito-control-rmi-cluster-example-1.0-SNAPSHOT-jar-with-dependencies.jar example.Daemon
This script will allow me to start my super-duper daemon the easy way. So after starting the daemon and waiting one-two minutes I can see following output:

Adding Monitoring capabilities
So, after our guinea pig is all set up, lets add monitoring to it. We want to know the answer to two questions:
- Do all my daemons run?
- What are they doing, and are they doing ok?
We are going to use MoSKito Control to get answers to both those questions. The first step is to configure the monitoring of the Worker.
Watching the Worker
To monitor the worker, we simply annotate it with @Monitor annotation:
import net.anotheria.moskito.aop.annotation.Monitor;

@Monitor
public class Worker {
	public void doSomeWork(){
		//lets assume they do some work.
	}
}
This annotation, combined with some pom magic, will monitor all calls to the worker’s methods. We also want to inspect those values, so we configure a Threshold and an Accumulator for them. You can do it in the moskito.json file, which has to be somewhere in the classpath at runtime. This is also the file, where you could configure stuff like notifications or plugins, to get the data in another system.
We are going to accumulate all calls to doSomeWork method:
"@accumulatorsConfig" : {
    "accumulationAmount": 100,
    "@accumulators": [
        {
            "name": "WorkerLoad",
            "producerName": "Worker",
            "statName": "doSomeWork",
            "valueName": "Req",
            "intervalName": "1m"
        }
    ]
}
and set a threshold:
"@thresholdsConfig": {
    "@thresholds": [
        {
          "name": "WorkerLoad",
          "producerName": "Worker",
          "statName": "doSomeWork",
          "valueName": "Req",
          "intervalName": "1m",
          //timeUnit can be ignored here
          "@guards": [
           {"value": "30", "direction": "DOWN", "status": "GREEN"},
           {"value": "30", "direction": "UP", "status": "YELLOW"},
           {"value": "45", "direction": "UP", "status": "ORANGE"},
           {"value": "60", "direction": "UP", "status": "RED"},
           {"value": "100", "direction": "UP", "status": "PURPLE"}
          ]
        }
    ]
}
Adding the Agent.
So now we have perfectly monitoring daemon, but the data will remain in the daemon. To get the data out of the JVM and in the control we need to add an agent. Since we don’t have http here, we are going to work with the rmi agent.
First we have to add it to the pom:
<dependency>
  <groupId>org.moskito</groupId>
  <artifactId>moskito-control-agent-rmi-endpoint</artifactId>
  <version>1.1.0</version>
</dependency>
and than call the init method in our daemon:
public static void main(String args[]) throws InterruptedException{
	//start endpoint
	try {
		RMIEndpoint.startRMIEndpoint();
	}catch(RMIEndpointException e){
		System.err.println("Couldn't start rmi endpoint, quiting for the sake of the world");
		e.printStackTrace();
	}
}
Of course you shouldn’t call e.printStackTrace() in your code, but the example should be as simple as possible.
There is one last change that remains. Since we are connecting to our daemons from a remote location, we need a port. The daemon must now on which port to publish its data, to allow MoSKito Control go grab them. Long story, we need to add one more parameter to our start script:
java -cp src/main/resources:target/moskito-control-rmi-cluster-example-1.0-SNAPSHOT-jar-with-dependencies.jar -DlocalRmiRegistryPort=$1 example.Daemon
so now we will start with ./startDaemon.sh 9403 if we want to run the daemon at port 9403. Needless to say, each daemon should have its own port, otherwise the agent will fail to bind.
Configuring MoSKito Control
Now, to the other side of the things. MoSKito Control is configured via moskitocontrol.json. For this example I configured three instances of the daemon, but of course, you are free to run 100 or more.
"@applications": [
    {
        "name": "Daemons",
        "@components": [
            {
                "name": "first",
                "category": "daemon",
                "connectorType": "RMI",
                "location": "localhost:9401"
            },
            {
                "name": "second",
                "category": "daemon",
                "connectorType": "RMI",
                "location": "localhost:9402"
            },
            {
                "name": "third",
                "category": "daemon",
                "connectorType": "RMI",
                "location": "localhost:9403"
            }
        ]
    }
    ],
Please forgive me my uninspiring naming.
Now, to the final step:
Starting MoSKito Control
There are two ways to get and start MoSKito Control. First of all you will need a tomcat, jetty or another servlet container. Personally I run mine on port 8999. Than you will need MoSKito Control itself. You either download it from maven central or build your own. If you download it from maven, you will need to run it once, let it unpack, and replace moskitocontrol.json in the unpacked directory.
Personally I build my MoSKito Control all by myself:
https://github.com/anotheria/moskito-control
cp <moskitocontrol.json> moskito-control/etc/appdata
cd moskito-control
mvn package
Now, lets start the container and call the UI: http://localhost:8999/moskito-control/control/main
We will see some cute purpleness:
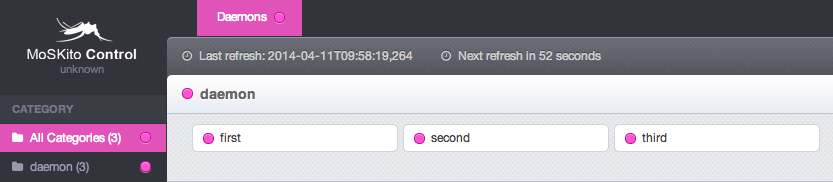
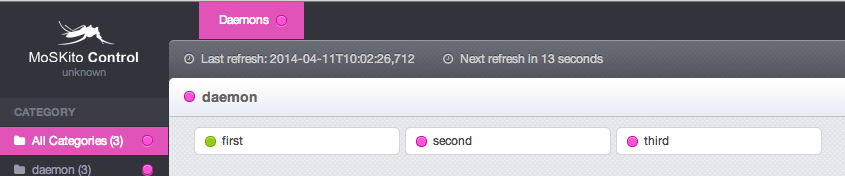
This is because we didn’t start any daemons yet. Lets start one at port 9401:

Look back into control some seconds later, will reveal that the first daemon got green:
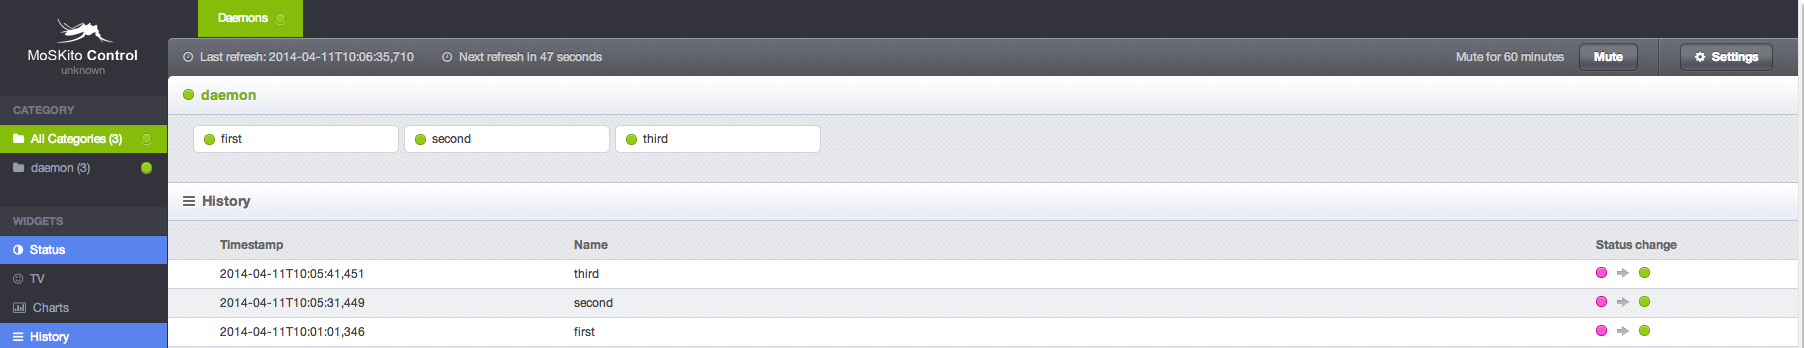
Ok, lets get the party going (start them in different terminal/console windows):
./startDaemon.sh 9402
./startDaemon.sh 9403
Now everything is green:
we can even switch on our tv mode now, and enjoy our smiling Mr GreenFace:
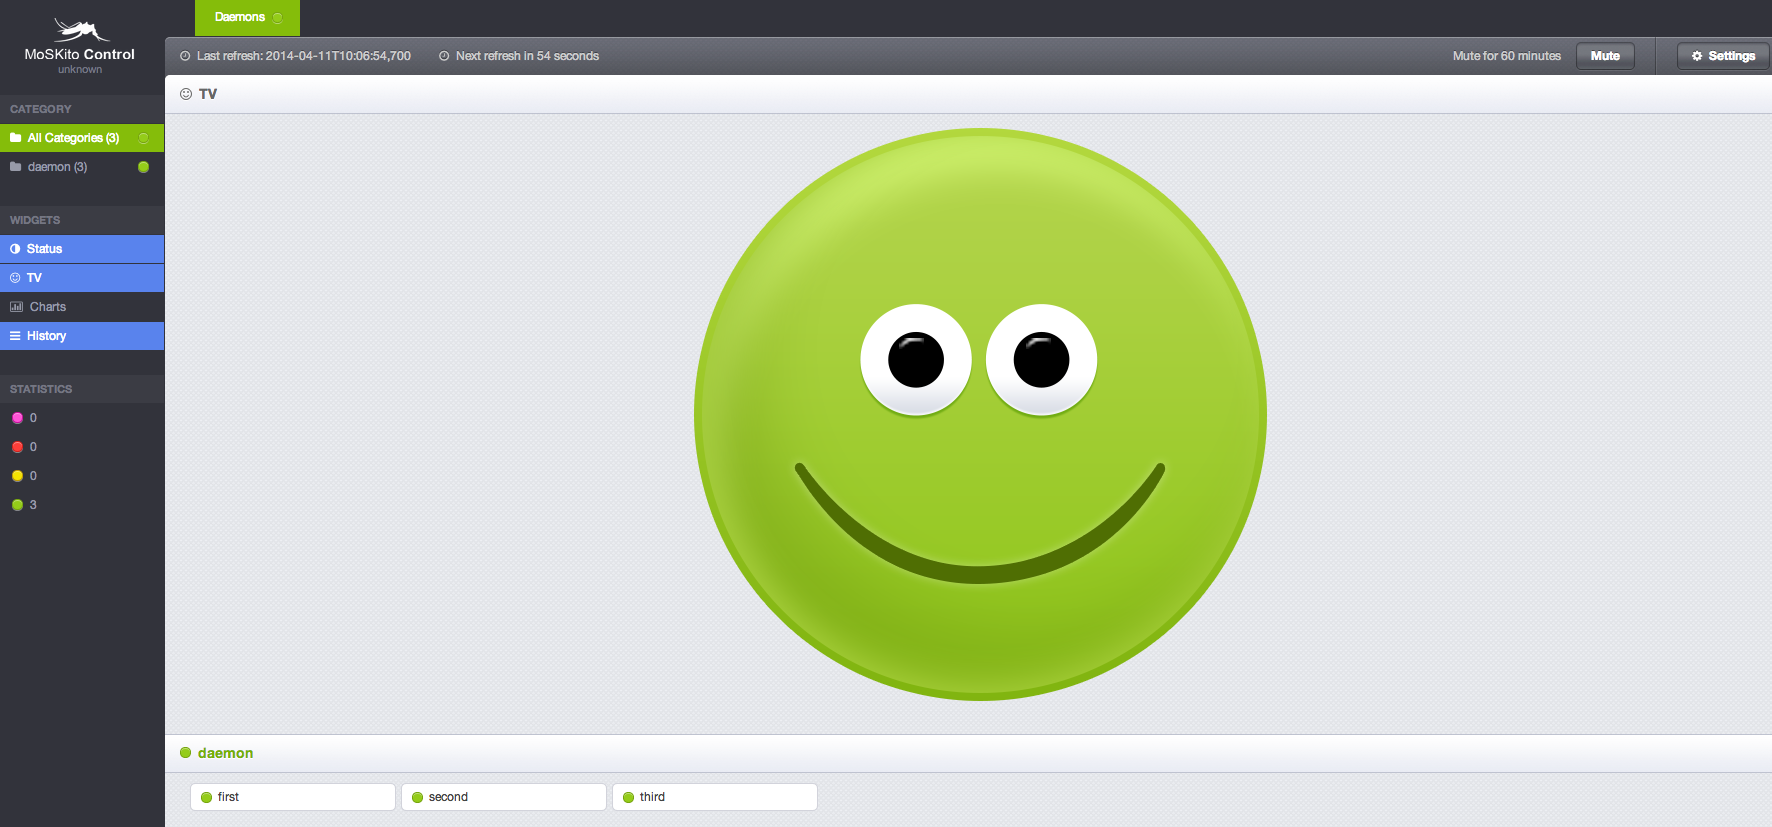
That’s it. You are now in full control of your cluster. Play around and enjoy.
Corresponding recipe in confluence: https://confluence.opensource.anotheria.net/display/MSK/Javaagent+light+and+multiple+java+processes