Custom dashboards are clearly one of the most useful visualization features MoSKito has to offer. The ability to see all related information at a glance collected in one place improves the analytic capabilities and help tracking the anomalies. However, until now, configuring a dashboard could be cumbersome especially with high amount of charts and producers. Also adding a new producer to the system would require to add it to the dashboard explicitly, a step that could easily be overlooked. With MoSKito 2.8.7 we improved!
Often we want to analyse a whole class of producers at once to be able to detect anomalies fast. For example we may want to monitor all services, all DAOs or all actions and see which one sticks out. Regardless of how we make the producers themselves known to the system, we will still have to configure every chart (accumulator) and the dashboard individually. This can be cumbersome, especially for newly added or removed producers. With auto-accumulators, chart- and producer-patterns we can now speed up the process.
As example we would like to monitor all services in our example burgershop application. The burgershop application serves as our integration guide here: The complete MoSKito integration guide – Step 1 and here: Monitoring existing application using MoSKito Javaagent. We will setup a new dashboard to see all services in the system and the related information.
Step1: Setup auto-accumulators
To show something on a dashboard we must have it first. Since we are monitoring services we want to see the request and error count, as well as total and average execution time. To automatically chart the values for every service we configure an auto-accumulator for every of the above values (request, error, total time, average duration):
    "@accumulatorsConfig" : {
        "accumulationAmount": 200,
        "@autoAccumulators": [
          {
            "namePattern": "$PRODUCERNAME.REQ.1m",
            "producerNamePattern": "(.*)Service",
            "statName": "cumulated",
            "valueName": "req",
            "intervalName": "1m"
          },
          {
            "namePattern": "$PRODUCERNAME.TIME.1m",
            "producerNamePattern": "(.*)Service",
            "statName": "cumulated",
            "valueName": "time",
            "intervalName": "1m"
          },
          {
            "namePattern": "$PRODUCERNAME.AVG.1m",
            "producerNamePattern": "(.*)Service",
            "statName": "cumulated",
            "valueName": "avg",
            "intervalName": "1m"
          },
          {
            "namePattern": "$PRODUCERNAME.ERR.1m",
            "producerNamePattern": "(.*)Service",
            "statName": "cumulated",
            "valueName": "err",
            "intervalName": "1m"
          }
The definition is pretty straight forward: for all producers where name matches to (.*)Service create a new accumulator for statName ‘cumulated‘ (this means cumulated requests to all methods in this service), interval of 1minute, and value ‘req‘, ‘avg‘, ‘time‘ and ‘err‘). This will create 4 new accumulators (charts) for every newly registered producer which name ends with ‘Service’. For example for ShopService in the demo we will get:
Please note that the charts will appear as soon as a new producer with matching name registers. This depends on the kind of producer, but usually producers register themselves on first usage.
Step2: Setup the dashboard
Now that we have our accumulators we can setup the dashboard. We want to see requests, errors, total and average duration of all services together (to see which one stands out) and the complete list of producers for further inquiries.
The dashboard config will be like this:
      {
        "name": "ServiceBoard",
        "@charts": [],
        "@chartPatterns": [
          {
            "caption": "Service Requests",
            "accumulatorPatterns": [
              "(.*)Service.REQ.1m"
            ]
          },
          {
            "caption": "Service Errors",
            "accumulatorPatterns": [
              "(.*)Service.ERR.1m"
            ]
          },
          {
            "caption": "Service TotalTime",
            "accumulatorPatterns": [
                "(.*)Service.TIME.1m"
              ]
          },
          {
            "caption": "Service Average Duration",
            "accumulatorPatterns": [
              "(.*)Service.AVG.1m"
            ]
          }


        ],
        "@producerNamePatterns": ["(.*)Service"]

      },
There are two things we configure here, the producer table and charts.
Beneath the usual chart element of the config (not in the above example), a new element chartPattern has been added. It consists of a caption and list of patterns for accumulator names. For example:
 {
            "caption": "Service Requests",
            "accumulatorPatterns": [
              "(.*)Service.REQ.1m"
            ]
          },
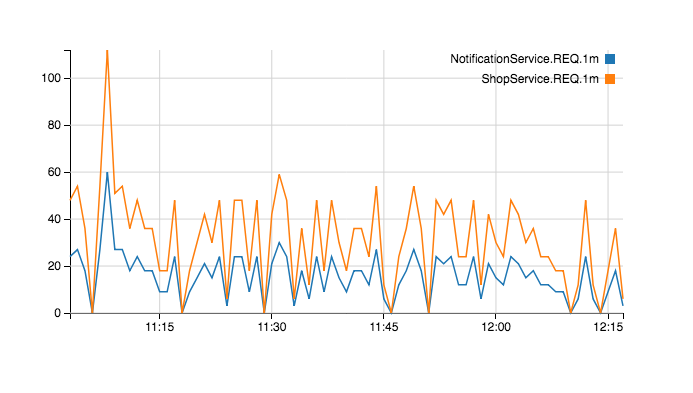
creates a new chart with multiple lines, caption “Service Requests” and one line for every accumulator with name matching (.*)Service.REQ.1m:
The producer table is a table on the dashboard which contains all configured producers, in our case all producers that match one or more patterns. With
"@producerNamePatterns": ["(.*)Service"]
all producers which names ends with ‘Service’ are shown. If after some time new producers with matching name arise, they will be added automatically on use. Regular expressions can be used to define the producerNamePattern.
With the burgershop example we only have two producers with Service in the name, hence our table looks like this:
Step3: Celebrate.
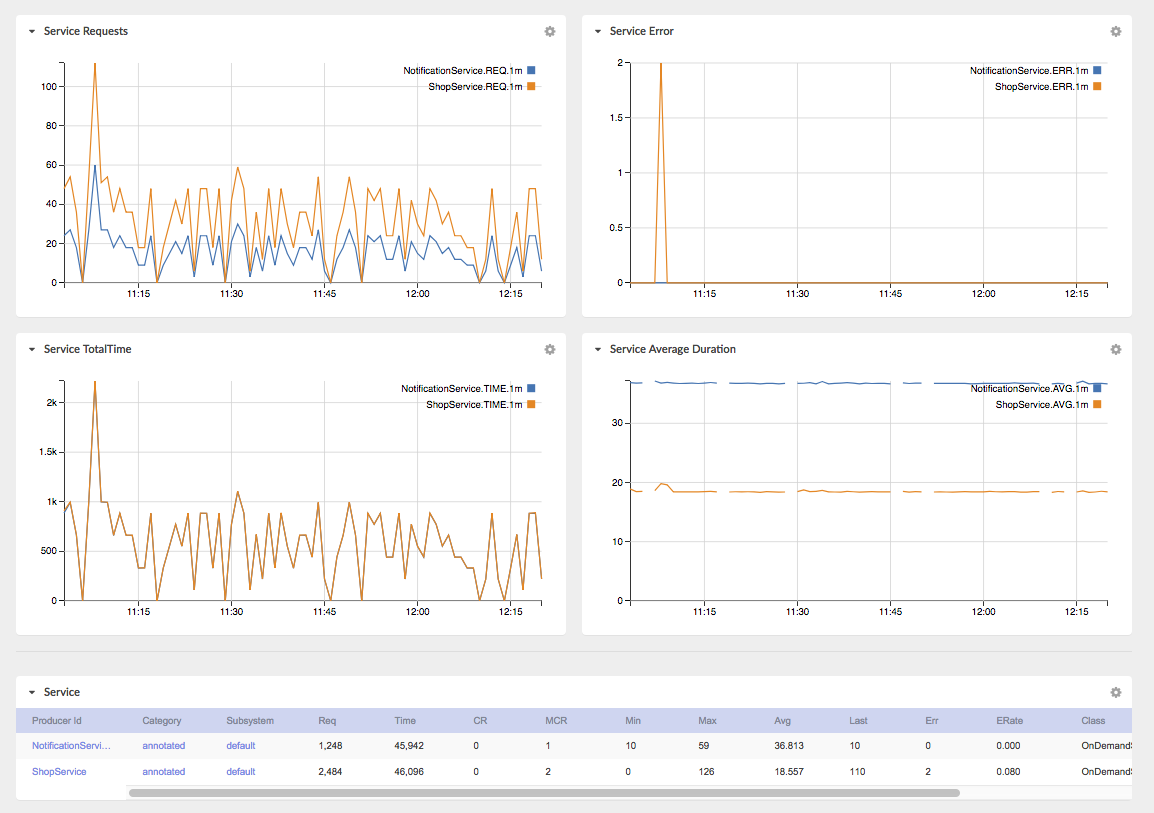
We are done. Now we have a new shiny dashboard called ServiceBoard which contains all our services, their REQ, Time, AVG Duration and Error Count statistic:
The Dashboard can be viewed under: http://burgershop-hamburg.demo.moskito.org/burgershop/moskito-inspect/mskDashboard?dashboard=ServiceBoard
Whenever new services will be added to the system, they will be automatically accumulated (charted) and added to the dashboard. When they disappear from the system, they’ll disappear from the dashboard to.
Please refer to the configuration guide for details on configuration of dashboards.
This feature is available from the version 2.8.7


